

 | ||
Preferred Label:
| ||
Our leading, pre-allocated investments, managed and rebalanced regularly by seasoned professionals, come at ultra-low costs and free you to focus on your charitable impact.
![]() Last updated 06/25/2026
Last updated 06/25/2026
Income
The Income portfolio solution is designed for those seeking to maximize their charitable giving in the next 0-5 years, while maintaining or growing their account assets. This lower risk, multi-fund investment option is intended to preserve a majority of principal while investing a small portion of assets into equities (stocks).
Expense Ratio
![]() Last updated 03/31/2026
Last updated 03/31/2026
0.01%
Risk/granting time horizon

Returns
![]() Last updated 03/31/2026
Last updated 03/31/2026
Qtr
-0.39%
1 Yr
7.66%
5 Yrs
2.33%
10 Yrs
—
Target Allocation
Underlying funds
Management
![]() Active funds focus on outperforming the market compared to a specific benchmark through a portfolio manager’s selections. Passive funds seek to mimic benchmarks by tracking an index
Active funds focus on outperforming the market compared to a specific benchmark through a portfolio manager’s selections. Passive funds seek to mimic benchmarks by tracking an index
passive
Goal
Seeks to provide current income and some capital appreciation through a target allocation of 20% stocks and 80% bonds.
Conservative Growth
The Conservative Growth portfolio solution is designed for those with current, ongoing grants who are also seeking to invest for future grants in approximately 5-10 years. This investment option is intended to preserve a majority of principal while investing a moderate portion into equities (stocks).
Expense Ratio
![]() Last updated 03/31/2026
Last updated 03/31/2026
0.01%
Risk/granting time horizon

Returns
![]() Last updated 03/31/2026
Last updated 03/31/2026
Qtr
-0.84%
1 Yr
11.21%
5 Yrs
4.35%
10 Yrs
6.15%
Target Allocation
Underlying funds
Management
![]() Active funds focus on outperforming the market compared to a specific benchmark through a portfolio manager’s selections. Passive funds seek to mimic benchmarks by tracking an index
Active funds focus on outperforming the market compared to a specific benchmark through a portfolio manager’s selections. Passive funds seek to mimic benchmarks by tracking an index
passive
Goal
Seeks to provide current income and low to moderate capital appreciation through a target allocation of 40% stocks and 60% bonds.
Moderate Growth
The Moderate Growth portfolio solution is designed for those who are willing to take on more risk to meet longer-term goals, while continuing to make current, ongoing grants.
Expense Ratio
![]() Last updated 03/31/2026
Last updated 03/31/2026
0.02%
Risk/granting time horizon
Returns
![]() Last updated 03/31/2026
Last updated 03/31/2026
Qtr
-1.30%
1 Yr
14.48%
5 Yrs
6.84%
10 Yrs
8.98%
Target Allocation
Underlying funds
Management
![]() Active funds focus on outperforming the market compared to a specific benchmark through a portfolio manager’s selections. Passive funds seek to mimic benchmarks by tracking an index
Active funds focus on outperforming the market compared to a specific benchmark through a portfolio manager’s selections. Passive funds seek to mimic benchmarks by tracking an index
passive
Goal
Growth
The Growth portfolio solution is designed for those with a longer-term philanthropic time horizon. This investment option provides greater exposure to equities (stocks) to support those with longer-term philanthropic goals. Philanthropists with an eye on the future may utilize this fund to help grow their giving legacy.
Expense Ratio
![]() Last updated 03/31/2026
Last updated 03/31/2026
0.02%
Risk/granting time horizon

Returns
![]() Last updated 03/31/2026
Last updated 03/31/2026
Qtr
-1.79%
1 Yr
17.73%
5 Yrs
8.08%
10 Yrs
10.22%
Target Allocation
Underlying funds
Management
![]() Active funds focus on outperforming the market compared to a specific benchmark through a portfolio manager’s selections. Passive funds seek to mimic benchmarks by tracking an index
Active funds focus on outperforming the market compared to a specific benchmark through a portfolio manager’s selections. Passive funds seek to mimic benchmarks by tracking an index
passive
Goal
Seeks to provide capital appreciation and some current income through a target allocation of 80% stocks and 20% bonds.
Wellington
The Vanguard Wellington™ Fund, founded in 1929, is the nation's oldest balanced mutual fund. Investment in Wellington, a low-cost, actively managed option, provides broad diversification across all economic sectors that can serve as a core portion of a donor's overall investment strategy for long-term philanthropy.
Expense Ratio
![]() Last updated 03/31/2026
Last updated 03/31/2026
0.16%
Risk/granting time horizon
Returns
![]() Last updated 03/31/2026
Last updated 03/31/2026
Qtr
-3.29%
1 Yr
14.62%
5 Yrs
7.88%
10 Yrs
—
Target Allocation
Underlying funds
Management
![]() Active funds focus on outperforming the market compared to a specific benchmark through a portfolio manager’s selections. Passive funds seek to mimic benchmarks by tracking an index
Active funds focus on outperforming the market compared to a specific benchmark through a portfolio manager’s selections. Passive funds seek to mimic benchmarks by tracking an index
active
Goal
Seeks long-term capital appreciation and reasonable current income, with moderate risk.
Balanced Index
Balanced Index uses an index sampling and passively managed approach, providing a low-cost option with moderate risk to philanthropists who are balancing short- and long-term giving goals.
Expense Ratio
![]() Last updated 03/31/2026
Last updated 03/31/2026
0.01%
Risk/granting time horizon
Returns
![]() Last updated 03/31/2026
Last updated 03/31/2026
Qtr
-2.37%
1 Yr
12.92%
5 Yrs
6.74%
10 Yrs
—
Target Allocation
Underlying funds
Management
![]() Active funds focus on outperforming the market compared to a specific benchmark through a portfolio manager’s selections. Passive funds seek to mimic benchmarks by tracking an index
Active funds focus on outperforming the market compared to a specific benchmark through a portfolio manager’s selections. Passive funds seek to mimic benchmarks by tracking an index
passive
Goal
Seeks capital appreciation, current income, and long-term growth of income.
These diverse, individual building blocks span asset classes and granting timeframes, and can be used to create a more customized charitable investment portfolio.
Index building blocks
Investment fees range from 0.01% to 0.11%
![]() Last updated 06/25/2026
Last updated 06/25/2026
Create the basis of your charitable portfolio
Short-Term TIPS
Short-Term Treasury Inflation-Protected Securities may be utilized by donors with shorter-term giving goals and less risk tolerance who are seeking a measure of protection from "unexpected inflation".
Expense Ratio
0.02%
Risk/granting time horizon

Returns
![]() Last updated 03/31/2026
Last updated 03/31/2026
Qtr
1.03%
1 Yr
3.95%
5 Yrs
—
10 Yrs
—
Underlying funds
Benchmark
Bloomberg U.S. 0-5 Year Treasury Inflation Protected Securities Index
Management
![]() Active funds focus on outperforming the market compared to a specific benchmark through a portfolio manager’s selections. Passive funds seek to mimic benchmarks by tracking an index
Active funds focus on outperforming the market compared to a specific benchmark through a portfolio manager’s selections. Passive funds seek to mimic benchmarks by tracking an index
passive
Goal
Seeks to offer protection against inflation with reduced price volatility through exposure to shorter-duration inflation-protected treasury bonds.
Total Bond
Total Bond may be utilized by donors who are not planning a significant amount of immediate granting, but who are working toward giving goals approximately 2-10 years in the future.
Expense Ratio
0.01%
Risk/granting time horizon

Returns
![]() Last updated 03/31/2026
Last updated 03/31/2026
Qtr
0.03%
1 Yr
4.33%
5 Yrs
0.34%
10 Yrs
1.70%
Underlying funds
Benchmark
Spliced Bloomberg Barclays U.S. Aggregate Float Adjusted Index
Management
![]() Active funds focus on outperforming the market compared to a specific benchmark through a portfolio manager’s selections. Passive funds seek to mimic benchmarks by tracking an index
Active funds focus on outperforming the market compared to a specific benchmark through a portfolio manager’s selections. Passive funds seek to mimic benchmarks by tracking an index
passive
Goal
Seeks to provide broad exposure to the investment-grade U.S. bond market.
Total International Bond
Total International Bond is designed to provide broad exposure to non-U.S. investment-grade bonds. This option offers diversification and can help reduce volatility of investment returns due to their low correlation to U.S. bonds. It can be aligned with both short-term and long-term goals.
Expense Ratio
0.03%
Risk/granting time horizon
Returns
![]() Last updated 03/31/2026
Last updated 03/31/2026
Qtr
-0.49%
1 Yr
2.68%
5 Yrs
0.20%
10 Yrs
—
Underlying funds
Benchmark
Bloomberg Barclays Global Aggregate ex-USD Float Adjusted RIC Capped Index (USD Hedged)
Management
![]() Active funds focus on outperforming the market compared to a specific benchmark through a portfolio manager’s selections. Passive funds seek to mimic benchmarks by tracking an index
Active funds focus on outperforming the market compared to a specific benchmark through a portfolio manager’s selections. Passive funds seek to mimic benchmarks by tracking an index
passive
Goal
Seeks to provide a diversified portfolio of U.S. dollar hedged, high-quality international bonds.
Total Equity
Total Equity, a multi-fund investment option, provides broad diversification and offers exposure to market performance of both U.S. and non-U.S. equities. For donors seeking to design their own target asset allocation, or those with a higher risk threshold and long-term granting plans, this low-cost option may be appealing.
Expense Ratio
0.03%
Risk/granting time horizon

Returns
![]() Last updated 03/31/2026
Last updated 03/31/2026
Qtr
-2.08%
1 Yr
21.17%
5 Yrs
9.68%
10 Yrs
12.18%
Underlying funds
Benchmark
Composite benchmark return: 55% S&P 500 Index, 15% S&P Completion Index, and 30% Spliced Total International Stock Market Index.
Management
![]() Active funds focus on outperforming the market compared to a specific benchmark through a portfolio manager’s selections. Passive funds seek to mimic benchmarks by tracking an index
Active funds focus on outperforming the market compared to a specific benchmark through a portfolio manager’s selections. Passive funds seek to mimic benchmarks by tracking an index
passive
Goal
Seeks to provide growth of capital through a 100% allocation to U.S. and international stocks.
Total U.S. Stock
Total U.S. Stock is a broadly diversified equity portfolio and aligns with long-term giving goals. For donors looking to grow their charitable assets over time to plan for a large gift or personal legacy, this fund provides that opportunity through equity investments.
Expense Ratio
0.01%
Risk/granting time horizon
Returns
![]() Last updated 03/31/2026
Last updated 03/31/2026
Qtr
-3.96%
1 Yr
18.21%
5 Yrs
10.80%
10 Yrs
13.69%
Underlying funds
Benchmark
Spliced Total Stock Market Index
Management
![]() Active funds focus on outperforming the market compared to a specific benchmark through a portfolio manager’s selections. Passive funds seek to mimic benchmarks by tracking an index
Active funds focus on outperforming the market compared to a specific benchmark through a portfolio manager’s selections. Passive funds seek to mimic benchmarks by tracking an index
passive
Goal
Seeks to provide exposure to large-, mid- and small-cap equities diversified across growth and value styles.
S&P 500
The S&P 500 pool is a broadly diversified equity portfolio achieving exposure to US large-cap stocks and aligning with long-term giving goals.
Expense Ratio
0.01%
Risk/granting time horizon
Returns
![]() Last updated 03/31/2026
Last updated 03/31/2026
Qtr
-4.35%
1 Yr
17.75%
5 Yrs
—
10 Yrs
—
Underlying funds
Benchmark
Standard & Poor’s 500 Index
Management
![]() Active funds focus on outperforming the market compared to a specific benchmark through a portfolio manager’s selections. Passive funds seek to mimic benchmarks by tracking an index
Active funds focus on outperforming the market compared to a specific benchmark through a portfolio manager’s selections. Passive funds seek to mimic benchmarks by tracking an index
passive
Goal
Seeks to track the performance of the Standard & Poor's 500 Index, which measures the investment return of large-cap stocks.
Large-Cap Growth
For donors with a long-term granting time horizon, an investment in Large-Cap Growth provides exposure to larger U.S. companies in market sectors that tend to grow more quickly than the broader market. These stocks may be more volatile than their value counterparts.
Expense Ratio
0.03%
Risk/granting time horizon
Returns
![]() Last updated 03/31/2026
Last updated 03/31/2026
Qtr
-10.40%
1 Yr
18.27%
5 Yrs
—
10 Yrs
—
Underlying funds
Benchmark
CRSP US Large Cap Growth Index
Management
![]() Active funds focus on outperforming the market compared to a specific benchmark through a portfolio manager’s selections. Passive funds seek to mimic benchmarks by tracking an index
Active funds focus on outperforming the market compared to a specific benchmark through a portfolio manager’s selections. Passive funds seek to mimic benchmarks by tracking an index
passive
Goal
Seeks to track the performance of CRSP US Large Cap Growth Index, providing exposure to a broad range of U.S. growth-oriented stocks as determined by a variety of growth factors.
Large-Cap Value
For donors with a long-term granting time horizon, an investment in Large-Cap Value provides exposure to larger U.S. companies in market sectors that tend to grow at a slower pace than the broader market and may be temporarily undervalued by investors.
Expense Ratio
0.03%
Risk/granting time horizon
Returns
![]() Last updated 03/31/2026
Last updated 03/31/2026
Qtr
3.36%
1 Yr
16.10%
5 Yrs
—
10 Yrs
—
Underlying funds
Benchmark
CRSP US Large-Cap Value Index
Management
![]() Active funds focus on outperforming the market compared to a specific benchmark through a portfolio manager’s selections. Passive funds seek to mimic benchmarks by tracking an index
Active funds focus on outperforming the market compared to a specific benchmark through a portfolio manager’s selections. Passive funds seek to mimic benchmarks by tracking an index
passive
Goal
Seeks to track the performance of CRSP US Large Cap Value Index, providing exposure to a broad range of U.S. value-oriented stocks as determined by a variety of value factors.
Real Estate
For donors with a long-term granting horizon, Real Estate provides an additional level of diversification for a traditional stock and bond based portfolio.
Expense Ratio
0.11%
Risk/granting time horizon
Returns
![]() Last updated 03/31/2026
Last updated 03/31/2026
Qtr
1.32%
1 Yr
1.86%
5 Yrs
—
10 Yrs
—
Underlying funds
Benchmark
MSCI U.S. IM Real Estate 25/50 Index
Management
![]() Active funds focus on outperforming the market compared to a specific benchmark through a portfolio manager’s selections. Passive funds seek to mimic benchmarks by tracking an index
Active funds focus on outperforming the market compared to a specific benchmark through a portfolio manager’s selections. Passive funds seek to mimic benchmarks by tracking an index
passive
Goal
Seeks to provide a high level of income and moderate long-term capital appreciation by tracking a benchmark index that measures the performance of publicly traded REITs and other real estate-related investments.
Extended Market
For donors with a long-term granting time horizon, an investment in Extended Market offers broad exposure to U.S. small- and mid-cap stocks.
Expense Ratio
0.035%
Risk/granting time horizon

Returns
![]() Last updated 03/31/2026
Last updated 03/31/2026
Qtr
-1.25%
1 Yr
20.82%
5 Yrs
—
10 Yrs
—
Underlying funds
Benchmark
S&P Completion Index
Management
![]() Active funds focus on outperforming the market compared to a specific benchmark through a portfolio manager’s selections. Passive funds seek to mimic benchmarks by tracking an index
Active funds focus on outperforming the market compared to a specific benchmark through a portfolio manager’s selections. Passive funds seek to mimic benchmarks by tracking an index
passive
Goal
Seeks to track the performance of the S&P Completion Index, providing broad exposure to U.S. small- and mid-cap stocks.
Total International Stock
Total International Stock provides greater diversification of equities, which increases both risk and potential return. Donors with long-term or open-ended philanthropic views may utilize this fund to work toward future giving and legacy goals.
Expense Ratio
0.046%
Risk/granting time horizon
Returns
![]() Last updated 03/31/2026
Last updated 03/31/2026
Qtr
1.75%
1 Yr
27.53%
5 Yrs
7.53%
10 Yrs
8.75%
Underlying funds
Benchmark
Spliced Total International Stock Index
Management
![]() Active funds focus on outperforming the market compared to a specific benchmark through a portfolio manager’s selections. Passive funds seek to mimic benchmarks by tracking an index
Active funds focus on outperforming the market compared to a specific benchmark through a portfolio manager’s selections. Passive funds seek to mimic benchmarks by tracking an index
passive
Goal
Seeks to provide broad exposure across developed and emerging non-U.S. equity markets.
Emerging Markets
For donors with a long-term granting time horizon, an investment in Emerging Markets provides a portfolio with a larger allocation of stocks in this region and introduces a higher level of risk inherent in international stock investments.
Expense Ratio
0.05%
Risk/granting time horizon
Returns
![]() Last updated 03/31/2026
Last updated 03/31/2026
Qtr
-0.23%
1 Yr
21.99%
5 Yrs
3.91%
10 Yrs
7.55%
Underlying funds
Benchmark
FTSE Emerging Markets All Cap China A Inclusion Index
Management
![]() Active funds focus on outperforming the market compared to a specific benchmark through a portfolio manager’s selections. Passive funds seek to mimic benchmarks by tracking an index
Active funds focus on outperforming the market compared to a specific benchmark through a portfolio manager’s selections. Passive funds seek to mimic benchmarks by tracking an index
passive
Goal
Targets emerging markets common stocks.
European Stock
For donors with a long-term granting time horizon, an investment in European Stock provides a portfolio with a larger allocation of stocks in this region and introduces a higher level of risk inherent in international stock investments.
Expense Ratio
0.06%
Risk/granting time horizon
Returns
![]() Last updated 03/31/2026
Last updated 03/31/2026
Qtr
-0.99%
1 Yr
21.14%
5 Yrs
9.04%
10 Yrs
8.87%
Underlying funds
Benchmark
Spliced European Stock Index
Management
![]() Active funds focus on outperforming the market compared to a specific benchmark through a portfolio manager’s selections. Passive funds seek to mimic benchmarks by tracking an index
Active funds focus on outperforming the market compared to a specific benchmark through a portfolio manager’s selections. Passive funds seek to mimic benchmarks by tracking an index
passive
Goal
Targets European common stocks and is diversified across developed markets.
Pacific Stock
For donors with a long-term granting time horizon, an investment in Pacific Stock provides a portfolio with a larger allocation of stocks in this region and introduces a higher level of risk inherent in international stock investments.
Expense Ratio
0.07%
Risk/granting time horizon
Returns
![]() Last updated 03/31/2026
Last updated 03/31/2026
Qtr
7.41%
1 Yr
39.09%
5 Yrs
7.00%
10 Yrs
8.92%
Underlying funds
Benchmark
Spliced Pacific Stock Index
Management
![]() Active funds focus on outperforming the market compared to a specific benchmark through a portfolio manager’s selections. Passive funds seek to mimic benchmarks by tracking an index
Active funds focus on outperforming the market compared to a specific benchmark through a portfolio manager’s selections. Passive funds seek to mimic benchmarks by tracking an index
passive
Goal
Targets Pacific-region common stocks.
Active building blocks
Investment fees range from 0.07% to 3.29%
![]() Last updated 06/25/2026
Last updated 06/25/2026
Include additional international region exposure to your portfolio
Money Market
The Money Market investment option can be utilized to maintain an account balance in preparation for immediate giving needs. While donors may grant from Money Market, it is not necessary to make grants solely from this investment option.
Expense Ratio
0.10%
Risk/granting time horizon
Returns
![]() Last updated 03/31/2026
Last updated 03/31/2026
Qtr
0.91%
1 Yr
4.02%
5 Yrs
3.40%
10 Yrs
2.23%
Underlying funds
Benchmark
US Gov't Money Market Funds Average
Management
![]() Active funds focus on outperforming the market compared to a specific benchmark through a portfolio manager’s selections. Passive funds seek to mimic benchmarks by tracking an index
Active funds focus on outperforming the market compared to a specific benchmark through a portfolio manager’s selections. Passive funds seek to mimic benchmarks by tracking an index
active
Goal
Seeks to provide income while maintaining liquidity and a stable share price. Invests primarily in U.S. government agency obligations.
Ultra-Short-Term Bond
Ultra-Short-Term Bond may be utilized by donors with a shorter-term granting horizon and less risk tolerance.
Expense Ratio
0.09%
Risk/granting time horizon
Returns
![]() Last updated 03/31/2026
Last updated 03/31/2026
Qtr
0.68%
1 Yr
4.53%
5 Yrs
—
10 Yrs
—
Underlying funds
Benchmark
Bloomberg U.S. Treasury Bellweathers: 1 Year Index
Management
![]() Active funds focus on outperforming the market compared to a specific benchmark through a portfolio manager’s selections. Passive funds seek to mimic benchmarks by tracking an index
Active funds focus on outperforming the market compared to a specific benchmark through a portfolio manager’s selections. Passive funds seek to mimic benchmarks by tracking an index
active
Goal
Seeks to provide current income while maintaining limited price volatility and aggregate performance consistent with ultra-short-term, investment-grade, fixed-income securities.
Short-Term Bond
Donors with ongoing granting plans or current charitable goals may consider utilizing Short-Term Bond. This fund may be used as part of a diversified portfolio aligned to immediate and short-term giving goals.
Expense Ratio
0.07%
Risk/granting time horizon
Returns
![]() Last updated 03/31/2026
Last updated 03/31/2026
Qtr
0.22%
1 Yr
5.02%
5 Yrs
2.45%
10 Yrs
2.68%
Underlying funds
Benchmark
Bloomberg Barclays U.S. 1-5 Year Credit Index
Management
![]() Active funds focus on outperforming the market compared to a specific benchmark through a portfolio manager’s selections. Passive funds seek to mimic benchmarks by tracking an index
Active funds focus on outperforming the market compared to a specific benchmark through a portfolio manager’s selections. Passive funds seek to mimic benchmarks by tracking an index
passive
Goal
Seeks current income with limited price volatility and provides exposure to short-term, investment-grade fixed income securities.
Core Bond
For donors with a long-term granting horizon, Core Bond seeks to outperform the Bloomberg U.S. Aggregate Float Index by investing in fixed-income securities of various maturities, yields, and qualities.
Expense Ratio
0.10%
Risk/granting time horizon
Returns
![]() Last updated 03/31/2026
Last updated 03/31/2026
Qtr
-0.03%
1 Yr
4.55%
5 Yrs
—
10 Yrs
—
Underlying funds
Benchmark
Bloomberg U.S. Aggregate Float Adjusted Index
Management
![]() Active funds focus on outperforming the market compared to a specific benchmark through a portfolio manager’s selections. Passive funds seek to mimic benchmarks by tracking an index
Active funds focus on outperforming the market compared to a specific benchmark through a portfolio manager’s selections. Passive funds seek to mimic benchmarks by tracking an index
active
Goal
Seeks to provide total return while generating a moderate level of current income with diversified exposure primarily to investment-grade U.S. bonds.
High-Yield Corporate
For donors with a long-term granting horizon, an investment in High-Yield Corporate seeks to diversify their equity and fixed-income investments with below-investment-grade fixed-income holdings.
Expense Ratio
0.12%
Risk/granting time horizon

Returns
![]() Last updated 03/31/2026
Last updated 03/31/2026
Qtr
-0.57%
1 Yr
7.17%
5 Yrs
—
10 Yrs
—
Underlying funds
Benchmark
High-Yield Corporate Composite Index
Management
![]() Active funds focus on outperforming the market compared to a specific benchmark through a portfolio manager’s selections. Passive funds seek to mimic benchmarks by tracking an index
Active funds focus on outperforming the market compared to a specific benchmark through a portfolio manager’s selections. Passive funds seek to mimic benchmarks by tracking an index
active
Goal
Seeks a high and sustainable level of current income by investing primarily in below-investment-grade corporate securities offering attractive yields.
Dividend Growth
For donors with a long-term granting horizon seeking to own large-cap stocks that trade at a discount to the market or that possess an attractive risk/reward profile.
Expense Ratio
0.22%
Risk/granting time horizon
Returns
![]() Last updated 03/31/2026
Last updated 03/31/2026
Qtr
-5.14%
1 Yr
2.65%
5 Yrs
—
10 Yrs
—
Underlying funds
Benchmark
S&P U.S. Dividend Growers Index TR
Management
![]() Active funds focus on outperforming the market compared to a specific benchmark through a portfolio manager’s selections. Passive funds seek to mimic benchmarks by tracking an index
Active funds focus on outperforming the market compared to a specific benchmark through a portfolio manager’s selections. Passive funds seek to mimic benchmarks by tracking an index
active
Goal
Seeks to invest in a diversified array of stable, well-managed companies that have a history of or a potential for growing dividends over time.
U.S. Growth
For donors with a long-term granting horizon, U.S. Growth generally seeks an actively managed, multimanager investment in mostly large-cap U.S. growth companies.
Expense Ratio
0.25%
Risk/granting time horizon
Returns
![]() Last updated 03/31/2026
Last updated 03/31/2026
Qtr
-11.78%
1 Yr
13.62%
5 Yrs
—
10 Yrs
—
Underlying funds
Benchmark
Russell 1000 Growth Index
Management
![]() Active funds focus on outperforming the market compared to a specific benchmark through a portfolio manager’s selections. Passive funds seek to mimic benchmarks by tracking an index
Active funds focus on outperforming the market compared to a specific benchmark through a portfolio manager’s selections. Passive funds seek to mimic benchmarks by tracking an index
active
Goal
Seeks long-term capital appreciation by investing in a portfolio of large-cap stocks believed to have superior sustainable growth potential at reasonable valuations.
Windsor II
For donors with a long-term granting horizon, Windsor II seeks an actively managed, multimanager investment in U.S. mid- and large-cap value companies.
Expense Ratio
0.24%
Risk/granting time horizon
Returns
![]() Last updated 03/31/2026
Last updated 03/31/2026
Qtr
-1.13%
1 Yr
18.15%
5 Yrs
—
10 Yrs
—
Underlying funds
Benchmark
Russell 1000 Value Index
Management
![]() Active funds focus on outperforming the market compared to a specific benchmark through a portfolio manager’s selections. Passive funds seek to mimic benchmarks by tracking an index
Active funds focus on outperforming the market compared to a specific benchmark through a portfolio manager’s selections. Passive funds seek to mimic benchmarks by tracking an index
active
Goal
Seeks long-term capital appreciation and income by investing in a broadly diversified portfolio of mid- and large-cap value stocks.
Explorer
For donors with a long-term granting horizon, Explorer seeks an actively managed, multimanager investment in U.S. small- and mid-cap growth companies.
Expense Ratio
0.28%
Risk/granting time horizon
Returns
![]() Last updated 03/31/2026
Last updated 03/31/2026
Qtr
-0.08%
1 Yr
17.55%
5 Yrs
—
10 Yrs
—
Underlying funds
Benchmark
Russell 2500 Growth Index
Management
![]() Active funds focus on outperforming the market compared to a specific benchmark through a portfolio manager’s selections. Passive funds seek to mimic benchmarks by tracking an index
Active funds focus on outperforming the market compared to a specific benchmark through a portfolio manager’s selections. Passive funds seek to mimic benchmarks by tracking an index
active
Goal
Seeks long-term capital appreciation by investing in a broad universe of small- and mid-cap growth stocks.
Private Assets Fund
The Hamilton Lane Private Assets Fund is designed for donors with a long-term granting horizon (5+ years) who are looking for an actively managed, core Private Markets portfolio.
Expense Ratio
3.38%
Risk/granting time horizon
Returns
![]() Last updated 02/28/2026
Last updated 02/28/2026
Qtr
3.03%
1 Yr
16.02%
5 Yrs
—
10 Yrs
—
Underlying funds
Benchmark
MSCI World Index
Management
![]() Active funds focus on outperforming the market compared to a specific benchmark through a portfolio manager’s selections. Passive funds seek to mimic benchmarks by tracking an index
Active funds focus on outperforming the market compared to a specific benchmark through a portfolio manager’s selections. Passive funds seek to mimic benchmarks by tracking an index
active
Goal
Seeks medium and long-term capital appreciation by investing in direct and secondary investments targeting core private equity.
International Core Stock
For donors with a long-term granting horizon seeking actively managed investments in international mid- and large-cap companies.
Expense Ratio
0.38%
Risk/granting time horizon
Returns
![]() Last updated 03/31/2026
Last updated 03/31/2026
Qtr
2.76%
1 Yr
32.38%
5 Yrs
—
10 Yrs
—
Underlying funds
Benchmark
MSCI All Country World Index ex USA Net
Management
![]() Active funds focus on outperforming the market compared to a specific benchmark through a portfolio manager’s selections. Passive funds seek to mimic benchmarks by tracking an index
Active funds focus on outperforming the market compared to a specific benchmark through a portfolio manager’s selections. Passive funds seek to mimic benchmarks by tracking an index
active
Goal
Seeks to provide actively managed equity exposure to mid- and large-cap international stocks.
Commodity Strategy
For donors with a long-term granting horizon, an investment in Commodity Strategy seeks to diversify a portfolio with commodity-linked investments backed by a portfolio of inflation-linked investments and other fixed-income securities.
Expense Ratio
0.16%
Risk/granting time horizon
Returns
![]() Last updated 03/31/2026
Last updated 03/31/2026
Qtr
17.80%
1 Yr
25.98%
5 Yrs
—
10 Yrs
—
Underlying funds
Benchmark
Bloomberg Commodity Index Total Return
Management
![]() Active funds focus on outperforming the market compared to a specific benchmark through a portfolio manager’s selections. Passive funds seek to mimic benchmarks by tracking an index
Active funds focus on outperforming the market compared to a specific benchmark through a portfolio manager’s selections. Passive funds seek to mimic benchmarks by tracking an index
active
Goal
Seeks to provide broad commodities exposure and capital appreciation.
Values-driven Investments
Investment fees range from 0.09% to 0.59%
![]() Last updated 06/25/2026
Last updated 06/25/2026
Utilize these funds for a broad exposure
ESG U.S. Stock
ESG U.S. Stock allows donors to align charitable investments with personal values. Companies are screened for certain ESG criteria, and the fund utilizes three levels of restrictiveness for exclusions, as companies are screened on primary (i.e., producer/manufacturer) and, in most cases, secondary (i.e., retailer/supplier) involvement in the ESG exclusion categories using revenue-based thresholds. Least restrictive categories include adult entertainment, alcohol, and gambling. Moderately restrictive categories include tobacco, cannabis, and conventional (military) weapons. Most restrictive categories include controversial weapons, civilian firearms, nuclear power, and fossil fuels. The index fund also excludes stocks of certain companies that the index provider determines do not meet standards of U.N. global compact principles and companies that do not meet certain diversity criteria.
Expense Ratio
0.09%
Risk/granting time horizon
Returns
![]() Last updated 03/31/2026
Last updated 03/31/2026
Qtr
-6.94%
1 Yr
15.74%
5 Yrs
10.05%
10 Yrs
—
Underlying funds
Benchmark
FTSE U.S. All Cap Choice Index
Management
![]() Active funds focus on outperforming the market compared to a specific benchmark through a portfolio manager’s selections. Passive funds seek to mimic benchmarks by tracking an index
Active funds focus on outperforming the market compared to a specific benchmark through a portfolio manager’s selections. Passive funds seek to mimic benchmarks by tracking an index
passive
Goal
Seeks to track the performance of a benchmark index that measures the investment return of large-, mid-, and small-capitalization stocks of U.S. companies, while adhering to certain environmental, social, and corporate governance criteria.
ESG Global Stock
ESG Global Stock, a proprietary blend of ESG U.S. Stock and ESG International Stock, provides a broad diversification of equities, including a global investment allocation, in a passively managed index fund that is professionally rebalanced daily to maintain target allocation. For donors with a higher risk threshold and long-term granting plans, this low-cost and professionally-rebalanced values-driven fund may be an option.
Expense Ratio
0.09%
Risk/granting time horizon
Returns
![]() Last updated 03/31/2026
Last updated 03/31/2026
Qtr
-4.67%
1 Yr
18.91%
5 Yrs
9.03%
10 Yrs
—
Benchmark
70% FTSE U.S. All Cap Choice Index
30% FTSE Global All Cap ex U.S. Choice Index
Management
![]() Active funds focus on outperforming the market compared to a specific benchmark through a portfolio manager’s selections. Passive funds seek to mimic benchmarks by tracking an index
Active funds focus on outperforming the market compared to a specific benchmark through a portfolio manager’s selections. Passive funds seek to mimic benchmarks by tracking an index
passive
Goal
Provides exposure to U.S. and International stocks screened for certain environmental, social, and corporate governance criteria through a targeted, professionally rebalanced allocation of 70% U.S. and 30% International equity.
Global Positive Impact
For donors with a long-term granting horizon, Baillie Gifford Global Positive Impact Stock Fund seeks growth companies with the potential to outperform the fund’s benchmark over the long term that the portfolio managers consider to have core ambitions of delivering positive change.
Expense Ratio
0.59%
Risk/granting time horizon
Returns
![]() Last updated 03/31/2026
Last updated 03/31/2026
Qtr
-5.07%
1 Yr
14.56%
5 Yrs
—
10 Yrs
—
Underlying funds
Benchmark
MSCI All Country World Index
Management
![]() Active funds focus on outperforming the market compared to a specific benchmark through a portfolio manager’s selections. Passive funds seek to mimic benchmarks by tracking an index
Active funds focus on outperforming the market compared to a specific benchmark through a portfolio manager’s selections. Passive funds seek to mimic benchmarks by tracking an index
active
Goal
Seeks capital appreciation with an emphasis on investing in businesses that deliver positive change by contributing towards a more sustainable and inclusive world.
ESG International Stock
ESG International Stock allows donors to align charitable investments with personal values. Companies are screened for certain ESG criteria, and the fund utilizes three levels of restrictiveness for exclusions, as companies are screened on primary (i.e., producer/manufacturer) and, in most cases, secondary (i.e., retailer/supplier) involvement in the ESG exclusion categories using revenue-based thresholds. Least restrictive categories include adult entertainment, alcohol, and gambling. Moderately restrictive categories include tobacco, cannabis, and conventional (military) weapons. Most restrictive categories include controversial weapons, civilian firearms, nuclear power, and fossil fuels. The index fund also excludes stocks of certain companies that the index provider determines do not meet standards of U.N. global compact principles and companies that do not meet certain diversity criteria.
Expense Ratio
0.10%
Risk/granting time horizon
Returns
![]() Last updated 03/31/2026
Last updated 03/31/2026
Qtr
0.73%
1 Yr
25.81%
5 Yrs
6.28%
10 Yrs
—
Underlying funds
Benchmark
FTSE Global All Cap ex U.S. Choice Index
Management
![]() Active funds focus on outperforming the market compared to a specific benchmark through a portfolio manager’s selections. Passive funds seek to mimic benchmarks by tracking an index
Active funds focus on outperforming the market compared to a specific benchmark through a portfolio manager’s selections. Passive funds seek to mimic benchmarks by tracking an index
passive
Goal
Seeks to track the performance of a benchmark index that measures the investment return of large-, mid-, and small-capitalization companies located in developed and emerging markets outside of the United States, while adhering to certain environmental, social, and corporate governance criteria.
Portfolio Solutions  Pre-allocated investments, rebalanced daily by seasoned professionals
Expense Ratio ![]() Last updated 03/31/2026
Last updated 03/31/2026
0.01%
Risk/granting time horizon

Returns![]() Last updated 03/31/2026
Last updated 03/31/2026
Qtr
-0.39%
1 Yr
7.66%
5 Yrs
2.33%
10 Yrs
—
Target Allocation
Underlying funds
![]() Active funds focus on outperforming the market compared to a specific benchmark through a portfolio manager’s selections. Passive funds seek to mimic benchmarks by tracking an index
Active funds focus on outperforming the market compared to a specific benchmark through a portfolio manager’s selections. Passive funds seek to mimic benchmarks by tracking an index
passive
Goal
Seeks to provide current income and some capital appreciation through a target allocation of 20% stocks and 80% bonds.
Commentary
The Income portfolio solution is designed for those seeking to maximize their charitable giving in the next 0-5 years, while maintaining or growing their account assets. This lower risk, multi-fund investment option is intended to preserve a majority of principal while investing a small portion of assets into equities (stocks).
Expense Ratio ![]() Last updated 03/31/2026
Last updated 03/31/2026
0.01%
Risk/granting time horizon

Returns![]() Last updated 03/31/2026
Last updated 03/31/2026
Qtr
-0.84%
1 Yr
11.21%
5 Yrs
4.35%
10 Yrs
6.15%
Target Allocation
Underlying funds
![]() Active funds focus on outperforming the market compared to a specific benchmark through a portfolio manager’s selections. Passive funds seek to mimic benchmarks by tracking an index
Active funds focus on outperforming the market compared to a specific benchmark through a portfolio manager’s selections. Passive funds seek to mimic benchmarks by tracking an index
passive
Goal
Seeks to provide current income and low to moderate capital appreciation through a target allocation of 40% stocks and 60% bonds.
Commentary
The Conservative Growth portfolio solution is designed for those with current, ongoing grants who are also seeking to invest for future grants in approximately 5-10 years. This investment option is intended to preserve a majority of principal while investing a moderate portion into equities (stocks).
Expense Ratio ![]() Last updated 03/31/2026
Last updated 03/31/2026
0.02%
Risk/granting time horizon
Returns![]() Last updated 03/31/2026
Last updated 03/31/2026
Qtr
-1.30%
1 Yr
14.48%
5 Yrs
6.84%
10 Yrs
8.98%
Target Allocation
Underlying funds
![]() Active funds focus on outperforming the market compared to a specific benchmark through a portfolio manager’s selections. Passive funds seek to mimic benchmarks by tracking an index
Active funds focus on outperforming the market compared to a specific benchmark through a portfolio manager’s selections. Passive funds seek to mimic benchmarks by tracking an index
passive
Goal
Commentary
The Moderate Growth portfolio solution is designed for those who are willing to take on more risk to meet longer-term goals, while continuing to make current, ongoing grants.
Expense Ratio ![]() Last updated 03/31/2026
Last updated 03/31/2026
0.02%
Risk/granting time horizon

Returns![]() Last updated 03/31/2026
Last updated 03/31/2026
Qtr
-1.79%
1 Yr
17.73%
5 Yrs
8.08%
10 Yrs
10.22%
Target Allocation
Underlying funds
![]() Active funds focus on outperforming the market compared to a specific benchmark through a portfolio manager’s selections. Passive funds seek to mimic benchmarks by tracking an index
Active funds focus on outperforming the market compared to a specific benchmark through a portfolio manager’s selections. Passive funds seek to mimic benchmarks by tracking an index
passive
Goal
Seeks to provide capital appreciation and some current income through a target allocation of 80% stocks and 20% bonds.
Commentary
The Growth portfolio solution is designed for those with a longer-term philanthropic time horizon. This investment option provides greater exposure to equities (stocks) to support those with longer-term philanthropic goals. Philanthropists with an eye on the future may utilize this fund to help grow their giving legacy.
Expense Ratio ![]() Last updated 03/31/2026
Last updated 03/31/2026
0.16%
Risk/granting time horizon
Returns![]() Last updated 03/31/2026
Last updated 03/31/2026
Qtr
-3.29%
1 Yr
14.62%
5 Yrs
7.88%
10 Yrs
—
Target Allocation
Underlying funds
![]() Active funds focus on outperforming the market compared to a specific benchmark through a portfolio manager’s selections. Passive funds seek to mimic benchmarks by tracking an index
Active funds focus on outperforming the market compared to a specific benchmark through a portfolio manager’s selections. Passive funds seek to mimic benchmarks by tracking an index
active
Goal
Seeks long-term capital appreciation and reasonable current income, with moderate risk.
Commentary
The Vanguard Wellington™ Fund, founded in 1929, is the nation's oldest balanced mutual fund. Investment in Wellington, a low-cost, actively managed option, provides broad diversification across all economic sectors that can serve as a core portion of a donor's overall investment strategy for long-term philanthropy.
Expense Ratio ![]() Last updated 03/31/2026
Last updated 03/31/2026
0.01%
Risk/granting time horizon
Returns![]() Last updated 03/31/2026
Last updated 03/31/2026
Qtr
-2.37%
1 Yr
12.92%
5 Yrs
6.74%
10 Yrs
—
Target Allocation
Underlying funds
![]() Active funds focus on outperforming the market compared to a specific benchmark through a portfolio manager’s selections. Passive funds seek to mimic benchmarks by tracking an index
Active funds focus on outperforming the market compared to a specific benchmark through a portfolio manager’s selections. Passive funds seek to mimic benchmarks by tracking an index
passive
Goal
Seeks capital appreciation, current income, and long-term growth of income.
Commentary
Balanced Index uses an index sampling and passively managed approach, providing a low-cost option with moderate risk to philanthropists who are balancing short- and long-term giving goals.
Portfolio Builders Customized funds, driven by your giving timeline and goals.
Create the basis of your charitable portfolio
Expense Ratio ![]() Last updated 03/31/2026
Last updated 03/31/2026
0.02%
Risk/granting time horizon

Returns![]() Last updated 03/31/2026
Last updated 03/31/2026
Qtr
1.03%
1 Yr
3.95%
5 Yrs
—
10 Yrs
—
Benchmark
Bloomberg U.S. 0-5 Year Treasury Inflation Protected Securities Index
Underlying funds
![]() Active funds focus on outperforming the market compared to a specific benchmark through a portfolio manager’s selections. Passive funds seek to mimic benchmarks by tracking an index
Active funds focus on outperforming the market compared to a specific benchmark through a portfolio manager’s selections. Passive funds seek to mimic benchmarks by tracking an index
passive
Goal
Seeks to offer protection against inflation with reduced price volatility through exposure to shorter-duration inflation-protected treasury bonds.
Commentary
Short-Term Treasury Inflation-Protected Securities may be utilized by donors with shorter-term giving goals and less risk tolerance who are seeking a measure of protection from "unexpected inflation".
Expense Ratio ![]() Last updated 03/31/2026
Last updated 03/31/2026
0.01%
Risk/granting time horizon

Returns![]() Last updated 03/31/2026
Last updated 03/31/2026
Qtr
0.03%
1 Yr
4.33%
5 Yrs
0.34%
10 Yrs
1.70%
Benchmark
Spliced Bloomberg Barclays U.S. Aggregate Float Adjusted Index
Underlying funds
![]() Active funds focus on outperforming the market compared to a specific benchmark through a portfolio manager’s selections. Passive funds seek to mimic benchmarks by tracking an index
Active funds focus on outperforming the market compared to a specific benchmark through a portfolio manager’s selections. Passive funds seek to mimic benchmarks by tracking an index
passive
Goal
Seeks to provide broad exposure to the investment-grade U.S. bond market.
Commentary
Total Bond may be utilized by donors who are not planning a significant amount of immediate granting, but who are working toward giving goals approximately 2-10 years in the future.
Expense Ratio ![]() Last updated 03/31/2026
Last updated 03/31/2026
0.03%
Risk/granting time horizon
Returns![]() Last updated 03/31/2026
Last updated 03/31/2026
Qtr
-0.49%
1 Yr
2.68%
5 Yrs
0.20%
10 Yrs
—
Benchmark
Bloomberg Barclays Global Aggregate ex-USD Float Adjusted RIC Capped Index (USD Hedged)
Underlying funds
![]() Active funds focus on outperforming the market compared to a specific benchmark through a portfolio manager’s selections. Passive funds seek to mimic benchmarks by tracking an index
Active funds focus on outperforming the market compared to a specific benchmark through a portfolio manager’s selections. Passive funds seek to mimic benchmarks by tracking an index
passive
Goal
Seeks to provide a diversified portfolio of U.S. dollar hedged, high-quality international bonds.
Commentary
Total International Bond is designed to provide broad exposure to non-U.S. investment-grade bonds. This option offers diversification and can help reduce volatility of investment returns due to their low correlation to U.S. bonds. It can be aligned with both short-term and long-term goals.
Expense Ratio ![]() Last updated 03/31/2026
Last updated 03/31/2026
0.03%
Risk/granting time horizon

Returns![]() Last updated 03/31/2026
Last updated 03/31/2026
Qtr
-2.08%
1 Yr
21.17%
5 Yrs
9.68%
10 Yrs
12.18%
Benchmark
Composite benchmark return: 55% S&P 500 Index, 15% S&P Completion Index, and 30% Spliced Total International Stock Market Index.
Underlying funds
![]() Active funds focus on outperforming the market compared to a specific benchmark through a portfolio manager’s selections. Passive funds seek to mimic benchmarks by tracking an index
Active funds focus on outperforming the market compared to a specific benchmark through a portfolio manager’s selections. Passive funds seek to mimic benchmarks by tracking an index
passive
Goal
Seeks to provide growth of capital through a 100% allocation to U.S. and international stocks.
Commentary
Total Equity, a multi-fund investment option, provides broad diversification and offers exposure to market performance of both U.S. and non-U.S. equities. For donors seeking to design their own target asset allocation, or those with a higher risk threshold and long-term granting plans, this low-cost option may be appealing.
Expense Ratio ![]() Last updated 03/31/2026
Last updated 03/31/2026
0.01%
Risk/granting time horizon
Returns![]() Last updated 03/31/2026
Last updated 03/31/2026
Qtr
-3.96%
1 Yr
18.21%
5 Yrs
10.80%
10 Yrs
13.69%
Benchmark
Spliced Total Stock Market Index
Underlying funds
![]() Active funds focus on outperforming the market compared to a specific benchmark through a portfolio manager’s selections. Passive funds seek to mimic benchmarks by tracking an index
Active funds focus on outperforming the market compared to a specific benchmark through a portfolio manager’s selections. Passive funds seek to mimic benchmarks by tracking an index
passive
Goal
Seeks to provide exposure to large-, mid- and small-cap equities diversified across growth and value styles.
Commentary
Total U.S. Stock is a broadly diversified equity portfolio and aligns with long-term giving goals. For donors looking to grow their charitable assets over time to plan for a large gift or personal legacy, this fund provides that opportunity through equity investments.
Expense Ratio ![]() Last updated 04/16/2026
Last updated 04/16/2026
0.01%
Risk/granting time horizon
Returns![]() Last updated 03/31/2026
Last updated 03/31/2026
Qtr
-4.35%
1 Yr
17.75%
5 Yrs
—
10 Yrs
—
Benchmark
Standard & Poor’s 500 Index
Underlying funds
![]() Active funds focus on outperforming the market compared to a specific benchmark through a portfolio manager’s selections. Passive funds seek to mimic benchmarks by tracking an index
Active funds focus on outperforming the market compared to a specific benchmark through a portfolio manager’s selections. Passive funds seek to mimic benchmarks by tracking an index
passive
Goal
Seeks to track the performance of the Standard & Poor's 500 Index, which measures the investment return of large-cap stocks.
Commentary
The S&P 500 pool is a broadly diversified equity portfolio achieving exposure to US large-cap stocks and aligning with long-term giving goals.
Expense Ratio ![]() Last updated 03/31/2026
Last updated 03/31/2026
0.03%
Risk/granting time horizon
Returns![]() Last updated 03/31/2026
Last updated 03/31/2026
Qtr
-10.40%
1 Yr
18.27%
5 Yrs
—
10 Yrs
—
Benchmark
CRSP US Large Cap Growth Index
Underlying funds
![]() Active funds focus on outperforming the market compared to a specific benchmark through a portfolio manager’s selections. Passive funds seek to mimic benchmarks by tracking an index
Active funds focus on outperforming the market compared to a specific benchmark through a portfolio manager’s selections. Passive funds seek to mimic benchmarks by tracking an index
passive
Goal
Seeks to track the performance of CRSP US Large Cap Growth Index, providing exposure to a broad range of U.S. growth-oriented stocks as determined by a variety of growth factors.
Commentary
For donors with a long-term granting time horizon, an investment in Large-Cap Growth provides exposure to larger U.S. companies in market sectors that tend to grow more quickly than the broader market. These stocks may be more volatile than their value counterparts.
Expense Ratio ![]() Last updated 03/31/2026
Last updated 03/31/2026
0.03%
Risk/granting time horizon
Returns![]() Last updated 03/31/2026
Last updated 03/31/2026
Qtr
3.36%
1 Yr
16.10%
5 Yrs
—
10 Yrs
—
Benchmark
CRSP US Large-Cap Value Index
Underlying funds
![]() Active funds focus on outperforming the market compared to a specific benchmark through a portfolio manager’s selections. Passive funds seek to mimic benchmarks by tracking an index
Active funds focus on outperforming the market compared to a specific benchmark through a portfolio manager’s selections. Passive funds seek to mimic benchmarks by tracking an index
passive
Goal
Seeks to track the performance of CRSP US Large Cap Value Index, providing exposure to a broad range of U.S. value-oriented stocks as determined by a variety of value factors.
Commentary
For donors with a long-term granting time horizon, an investment in Large-Cap Value provides exposure to larger U.S. companies in market sectors that tend to grow at a slower pace than the broader market and may be temporarily undervalued by investors.
Expense Ratio ![]() Last updated 03/31/2026
Last updated 03/31/2026
0.11%
Risk/granting time horizon
Returns![]() Last updated 03/31/2026
Last updated 03/31/2026
Qtr
1.32%
1 Yr
1.86%
5 Yrs
—
10 Yrs
—
Benchmark
MSCI U.S. IM Real Estate 25/50 Index
Underlying funds
![]() Active funds focus on outperforming the market compared to a specific benchmark through a portfolio manager’s selections. Passive funds seek to mimic benchmarks by tracking an index
Active funds focus on outperforming the market compared to a specific benchmark through a portfolio manager’s selections. Passive funds seek to mimic benchmarks by tracking an index
passive
Goal
Seeks to provide a high level of income and moderate long-term capital appreciation by tracking a benchmark index that measures the performance of publicly traded REITs and other real estate-related investments.
Commentary
For donors with a long-term granting horizon, Real Estate provides an additional level of diversification for a traditional stock and bond based portfolio.
Expense Ratio ![]() Last updated 03/31/2026
Last updated 03/31/2026
0.035%
Risk/granting time horizon

Returns![]() Last updated 03/31/2026
Last updated 03/31/2026
Qtr
-1.25%
1 Yr
20.82%
5 Yrs
—
10 Yrs
—
Benchmark
S&P Completion Index
Underlying funds
![]() Active funds focus on outperforming the market compared to a specific benchmark through a portfolio manager’s selections. Passive funds seek to mimic benchmarks by tracking an index
Active funds focus on outperforming the market compared to a specific benchmark through a portfolio manager’s selections. Passive funds seek to mimic benchmarks by tracking an index
passive
Goal
Seeks to track the performance of the S&P Completion Index, providing broad exposure to U.S. small- and mid-cap stocks.
Commentary
For donors with a long-term granting time horizon, an investment in Extended Market offers broad exposure to U.S. small- and mid-cap stocks.
Expense Ratio ![]() Last updated 03/31/2026
Last updated 03/31/2026
0.046%
Risk/granting time horizon
Returns![]() Last updated 03/31/2026
Last updated 03/31/2026
Qtr
1.75%
1 Yr
27.53%
5 Yrs
7.53%
10 Yrs
8.75%
Benchmark
Spliced Total International Stock Index
Underlying funds
![]() Active funds focus on outperforming the market compared to a specific benchmark through a portfolio manager’s selections. Passive funds seek to mimic benchmarks by tracking an index
Active funds focus on outperforming the market compared to a specific benchmark through a portfolio manager’s selections. Passive funds seek to mimic benchmarks by tracking an index
passive
Goal
Seeks to provide broad exposure across developed and emerging non-U.S. equity markets.
Commentary
Total International Stock provides greater diversification of equities, which increases both risk and potential return. Donors with long-term or open-ended philanthropic views may utilize this fund to work toward future giving and legacy goals.
Expense Ratio ![]() Last updated 03/31/2026
Last updated 03/31/2026
0.05%
Risk/granting time horizon
Returns![]() Last updated 03/31/2026
Last updated 03/31/2026
Qtr
-0.23%
1 Yr
21.99%
5 Yrs
3.91%
10 Yrs
7.55%
Benchmark
FTSE Emerging Markets All Cap China A Inclusion Index
Underlying funds
![]() Active funds focus on outperforming the market compared to a specific benchmark through a portfolio manager’s selections. Passive funds seek to mimic benchmarks by tracking an index
Active funds focus on outperforming the market compared to a specific benchmark through a portfolio manager’s selections. Passive funds seek to mimic benchmarks by tracking an index
passive
Goal
Targets emerging markets common stocks.
Commentary
For donors with a long-term granting time horizon, an investment in Emerging Markets provides a portfolio with a larger allocation of stocks in this region and introduces a higher level of risk inherent in international stock investments.
Expense Ratio ![]() Last updated 03/31/2026
Last updated 03/31/2026
0.06%
Risk/granting time horizon
Returns![]() Last updated 03/31/2026
Last updated 03/31/2026
Qtr
-0.99%
1 Yr
21.14%
5 Yrs
9.04%
10 Yrs
8.87%
Benchmark
Spliced European Stock Index
Underlying funds
![]() Active funds focus on outperforming the market compared to a specific benchmark through a portfolio manager’s selections. Passive funds seek to mimic benchmarks by tracking an index
Active funds focus on outperforming the market compared to a specific benchmark through a portfolio manager’s selections. Passive funds seek to mimic benchmarks by tracking an index
passive
Goal
Targets European common stocks and is diversified across developed markets.
Commentary
For donors with a long-term granting time horizon, an investment in European Stock provides a portfolio with a larger allocation of stocks in this region and introduces a higher level of risk inherent in international stock investments.
Expense Ratio ![]() Last updated 03/31/2026
Last updated 03/31/2026
0.07%
Risk/granting time horizon
Returns![]() Last updated 03/31/2026
Last updated 03/31/2026
Qtr
7.41%
1 Yr
39.09%
5 Yrs
7.00%
10 Yrs
8.92%
Benchmark
Spliced Pacific Stock Index
Underlying funds
![]() Active funds focus on outperforming the market compared to a specific benchmark through a portfolio manager’s selections. Passive funds seek to mimic benchmarks by tracking an index
Active funds focus on outperforming the market compared to a specific benchmark through a portfolio manager’s selections. Passive funds seek to mimic benchmarks by tracking an index
passive
Goal
Targets Pacific-region common stocks.
Commentary
For donors with a long-term granting time horizon, an investment in Pacific Stock provides a portfolio with a larger allocation of stocks in this region and introduces a higher level of risk inherent in international stock investments.
Include additional international region exposure to your portfolio
Expense Ratio ![]() Last updated 03/31/2026
Last updated 03/31/2026
0.10%
Risk/granting time horizon
Returns![]() Last updated 03/31/2026
Last updated 03/31/2026
Qtr
0.91%
1 Yr
4.02%
5 Yrs
3.40%
10 Yrs
2.23%
Benchmark
US Gov't Money Market Funds Average
Underlying funds
![]() Active funds focus on outperforming the market compared to a specific benchmark through a portfolio manager’s selections. Passive funds seek to mimic benchmarks by tracking an index
Active funds focus on outperforming the market compared to a specific benchmark through a portfolio manager’s selections. Passive funds seek to mimic benchmarks by tracking an index
active
Goal
Seeks to provide income while maintaining liquidity and a stable share price. Invests primarily in U.S. government agency obligations.
Commentary
The Money Market investment option can be utilized to maintain an account balance in preparation for immediate giving needs. While donors may grant from Money Market, it is not necessary to make grants solely from this investment option.
Expense Ratio ![]() Last updated 03/31/2026
Last updated 03/31/2026
0.09%
Risk/granting time horizon
Returns![]() Last updated 03/31/2026
Last updated 03/31/2026
Qtr
0.68%
1 Yr
4.53%
5 Yrs
—
10 Yrs
—
Benchmark
Bloomberg U.S. Treasury Bellweathers: 1 Year Index
Underlying funds
![]() Active funds focus on outperforming the market compared to a specific benchmark through a portfolio manager’s selections. Passive funds seek to mimic benchmarks by tracking an index
Active funds focus on outperforming the market compared to a specific benchmark through a portfolio manager’s selections. Passive funds seek to mimic benchmarks by tracking an index
active
Goal
Seeks to provide current income while maintaining limited price volatility and aggregate performance consistent with ultra-short-term, investment-grade, fixed-income securities.
Commentary
Ultra-Short-Term Bond may be utilized by donors with a shorter-term granting horizon and less risk tolerance.
Expense Ratio ![]() Last updated 03/31/2026
Last updated 03/31/2026
0.07%
Risk/granting time horizon
Returns![]() Last updated 03/31/2026
Last updated 03/31/2026
Qtr
0.22%
1 Yr
5.02%
5 Yrs
2.45%
10 Yrs
2.68%
Benchmark
Bloomberg Barclays U.S. 1-5 Year Credit Index
Underlying funds
![]() Active funds focus on outperforming the market compared to a specific benchmark through a portfolio manager’s selections. Passive funds seek to mimic benchmarks by tracking an index
Active funds focus on outperforming the market compared to a specific benchmark through a portfolio manager’s selections. Passive funds seek to mimic benchmarks by tracking an index
passive
Goal
Seeks current income with limited price volatility and provides exposure to short-term, investment-grade fixed income securities.
Commentary
Donors with ongoing granting plans or current charitable goals may consider utilizing Short-Term Bond. This fund may be used as part of a diversified portfolio aligned to immediate and short-term giving goals.
Expense Ratio ![]() Last updated 03/31/2026
Last updated 03/31/2026
0.10%
Risk/granting time horizon
Returns![]() Last updated 03/31/2026
Last updated 03/31/2026
Qtr
-0.03%
1 Yr
4.55%
5 Yrs
—
10 Yrs
—
Benchmark
Bloomberg U.S. Aggregate Float Adjusted Index
Underlying funds
![]() Active funds focus on outperforming the market compared to a specific benchmark through a portfolio manager’s selections. Passive funds seek to mimic benchmarks by tracking an index
Active funds focus on outperforming the market compared to a specific benchmark through a portfolio manager’s selections. Passive funds seek to mimic benchmarks by tracking an index
active
Goal
Seeks to provide total return while generating a moderate level of current income with diversified exposure primarily to investment-grade U.S. bonds.
Commentary
For donors with a long-term granting horizon, Core Bond seeks to outperform the Bloomberg U.S. Aggregate Float Index by investing in fixed-income securities of various maturities, yields, and qualities.
Expense Ratio ![]() Last updated 03/31/2026
Last updated 03/31/2026
0.12%
Risk/granting time horizon

Returns![]() Last updated 03/31/2026
Last updated 03/31/2026
Qtr
-0.57%
1 Yr
7.17%
5 Yrs
—
10 Yrs
—
Benchmark
High-Yield Corporate Composite Index
Underlying funds
![]() Active funds focus on outperforming the market compared to a specific benchmark through a portfolio manager’s selections. Passive funds seek to mimic benchmarks by tracking an index
Active funds focus on outperforming the market compared to a specific benchmark through a portfolio manager’s selections. Passive funds seek to mimic benchmarks by tracking an index
active
Goal
Seeks a high and sustainable level of current income by investing primarily in below-investment-grade corporate securities offering attractive yields.
Commentary
For donors with a long-term granting horizon, an investment in High-Yield Corporate seeks to diversify their equity and fixed-income investments with below-investment-grade fixed-income holdings.
Expense Ratio ![]() Last updated 03/31/2026
Last updated 03/31/2026
0.22%
Risk/granting time horizon
Returns![]() Last updated 03/31/2026
Last updated 03/31/2026
Qtr
-5.14%
1 Yr
2.65%
5 Yrs
—
10 Yrs
—
Benchmark
S&P U.S. Dividend Growers Index TR
Underlying funds
![]() Active funds focus on outperforming the market compared to a specific benchmark through a portfolio manager’s selections. Passive funds seek to mimic benchmarks by tracking an index
Active funds focus on outperforming the market compared to a specific benchmark through a portfolio manager’s selections. Passive funds seek to mimic benchmarks by tracking an index
active
Goal
Seeks to invest in a diversified array of stable, well-managed companies that have a history of or a potential for growing dividends over time.
Commentary
For donors with a long-term granting horizon seeking to own large-cap stocks that trade at a discount to the market or that possess an attractive risk/reward profile.
Expense Ratio ![]() Last updated 03/31/2026
Last updated 03/31/2026
0.25%
Risk/granting time horizon
Returns![]() Last updated 03/31/2026
Last updated 03/31/2026
Qtr
-11.78%
1 Yr
13.62%
5 Yrs
—
10 Yrs
—
Benchmark
Russell 1000 Growth Index
Underlying funds
![]() Active funds focus on outperforming the market compared to a specific benchmark through a portfolio manager’s selections. Passive funds seek to mimic benchmarks by tracking an index
Active funds focus on outperforming the market compared to a specific benchmark through a portfolio manager’s selections. Passive funds seek to mimic benchmarks by tracking an index
active
Goal
Seeks long-term capital appreciation by investing in a portfolio of large-cap stocks believed to have superior sustainable growth potential at reasonable valuations.
Commentary
For donors with a long-term granting horizon, U.S. Growth generally seeks an actively managed, multimanager investment in mostly large-cap U.S. growth companies.
Expense Ratio ![]() Last updated 03/31/2026
Last updated 03/31/2026
0.24%
Risk/granting time horizon
Returns![]() Last updated 03/31/2026
Last updated 03/31/2026
Qtr
-1.13%
1 Yr
18.15%
5 Yrs
—
10 Yrs
—
Benchmark
Russell 1000 Value Index
Underlying funds
![]() Active funds focus on outperforming the market compared to a specific benchmark through a portfolio manager’s selections. Passive funds seek to mimic benchmarks by tracking an index
Active funds focus on outperforming the market compared to a specific benchmark through a portfolio manager’s selections. Passive funds seek to mimic benchmarks by tracking an index
active
Goal
Seeks long-term capital appreciation and income by investing in a broadly diversified portfolio of mid- and large-cap value stocks.
Commentary
For donors with a long-term granting horizon, Windsor II seeks an actively managed, multimanager investment in U.S. mid- and large-cap value companies.
Expense Ratio ![]() Last updated 03/31/2026
Last updated 03/31/2026
0.28%
Risk/granting time horizon
Returns![]() Last updated 03/31/2026
Last updated 03/31/2026
Qtr
-0.08%
1 Yr
17.55%
5 Yrs
—
10 Yrs
—
Benchmark
Russell 2500 Growth Index
Underlying funds
![]() Active funds focus on outperforming the market compared to a specific benchmark through a portfolio manager’s selections. Passive funds seek to mimic benchmarks by tracking an index
Active funds focus on outperforming the market compared to a specific benchmark through a portfolio manager’s selections. Passive funds seek to mimic benchmarks by tracking an index
active
Goal
Seeks long-term capital appreciation by investing in a broad universe of small- and mid-cap growth stocks.
Commentary
For donors with a long-term granting horizon, Explorer seeks an actively managed, multimanager investment in U.S. small- and mid-cap growth companies.
Expense Ratio ![]() Last updated 02/24/2026
Last updated 02/24/2026
3.38%
Risk/granting time horizon
Returns![]() Last updated 02/28/2026
Last updated 02/28/2026
Qtr
3.03%
1 Yr
16.02%
5 Yrs
—
10 Yrs
—
Benchmark
MSCI World Index
Underlying funds
![]() Active funds focus on outperforming the market compared to a specific benchmark through a portfolio manager’s selections. Passive funds seek to mimic benchmarks by tracking an index
Active funds focus on outperforming the market compared to a specific benchmark through a portfolio manager’s selections. Passive funds seek to mimic benchmarks by tracking an index
active
Goal
Seeks medium and long-term capital appreciation by investing in direct and secondary investments targeting core private equity.
Commentary
The Hamilton Lane Private Assets Fund is designed for donors with a long-term granting horizon (5+ years) who are looking for an actively managed, core Private Markets portfolio.
Expense Ratio ![]() Last updated 03/31/2026
Last updated 03/31/2026
0.38%
Risk/granting time horizon
Returns![]() Last updated 03/31/2026
Last updated 03/31/2026
Qtr
2.76%
1 Yr
32.38%
5 Yrs
—
10 Yrs
—
Benchmark
MSCI All Country World Index ex USA Net
Underlying funds
![]() Active funds focus on outperforming the market compared to a specific benchmark through a portfolio manager’s selections. Passive funds seek to mimic benchmarks by tracking an index
Active funds focus on outperforming the market compared to a specific benchmark through a portfolio manager’s selections. Passive funds seek to mimic benchmarks by tracking an index
active
Goal
Seeks to provide actively managed equity exposure to mid- and large-cap international stocks.
Commentary
For donors with a long-term granting horizon seeking actively managed investments in international mid- and large-cap companies.
Expense Ratio ![]() Last updated 03/31/2026
Last updated 03/31/2026
0.16%
Risk/granting time horizon
Returns![]() Last updated 03/31/2026
Last updated 03/31/2026
Qtr
17.80%
1 Yr
25.98%
5 Yrs
—
10 Yrs
—
Benchmark
Bloomberg Commodity Index Total Return
Underlying funds
![]() Active funds focus on outperforming the market compared to a specific benchmark through a portfolio manager’s selections. Passive funds seek to mimic benchmarks by tracking an index
Active funds focus on outperforming the market compared to a specific benchmark through a portfolio manager’s selections. Passive funds seek to mimic benchmarks by tracking an index
active
Goal
Seeks to provide broad commodities exposure and capital appreciation.
Commentary
For donors with a long-term granting horizon, an investment in Commodity Strategy seeks to diversify a portfolio with commodity-linked investments backed by a portfolio of inflation-linked investments and other fixed-income securities.
Utilize these funds for a broad exposure
Expense Ratio ![]() Last updated 03/31/2026
Last updated 03/31/2026
0.09%
Risk/granting time horizon
Returns![]() Last updated 03/31/2026
Last updated 03/31/2026
Qtr
-6.94%
1 Yr
15.74%
5 Yrs
10.05%
10 Yrs
—
Benchmark
FTSE U.S. All Cap Choice Index
Underlying funds
![]() Active funds focus on outperforming the market compared to a specific benchmark through a portfolio manager’s selections. Passive funds seek to mimic benchmarks by tracking an index
Active funds focus on outperforming the market compared to a specific benchmark through a portfolio manager’s selections. Passive funds seek to mimic benchmarks by tracking an index
passive
Goal
Seeks to track the performance of a benchmark index that measures the investment return of large-, mid-, and small-capitalization stocks of U.S. companies, while adhering to certain environmental, social, and corporate governance criteria.
Commentary
ESG U.S. Stock allows donors to align charitable investments with personal values. Companies are screened for certain ESG criteria, and the fund utilizes three levels of restrictiveness for exclusions, as companies are screened on primary (i.e., producer/manufacturer) and, in most cases, secondary (i.e., retailer/supplier) involvement in the ESG exclusion categories using revenue-based thresholds. Least restrictive categories include adult entertainment, alcohol, and gambling. Moderately restrictive categories include tobacco, cannabis, and conventional (military) weapons. Most restrictive categories include controversial weapons, civilian firearms, nuclear power, and fossil fuels. The index fund also excludes stocks of certain companies that the index provider determines do not meet standards of U.N. global compact principles and companies that do not meet certain diversity criteria.
Expense Ratio ![]() Last updated 03/31/2026
Last updated 03/31/2026
0.09%
Risk/granting time horizon
Returns![]() Last updated 03/31/2026
Last updated 03/31/2026
Qtr
-4.67%
1 Yr
18.91%
5 Yrs
9.03%
10 Yrs
—
Benchmark
70% FTSE U.S. All Cap Choice Index
30% FTSE Global All Cap ex U.S. Choice Index
![]() Active funds focus on outperforming the market compared to a specific benchmark through a portfolio manager’s selections. Passive funds seek to mimic benchmarks by tracking an index
Active funds focus on outperforming the market compared to a specific benchmark through a portfolio manager’s selections. Passive funds seek to mimic benchmarks by tracking an index
passive
Goal
Provides exposure to U.S. and International stocks screened for certain environmental, social, and corporate governance criteria through a targeted, professionally rebalanced allocation of 70% U.S. and 30% International equity.
Commentary
ESG Global Stock, a proprietary blend of ESG U.S. Stock and ESG International Stock, provides a broad diversification of equities, including a global investment allocation, in a passively managed index fund that is professionally rebalanced daily to maintain target allocation. For donors with a higher risk threshold and long-term granting plans, this low-cost and professionally-rebalanced values-driven fund may be an option.
Expense Ratio ![]() Last updated 03/31/2026
Last updated 03/31/2026
0.59%
Risk/granting time horizon
Returns![]() Last updated 03/31/2026
Last updated 03/31/2026
Qtr
-5.07%
1 Yr
14.56%
5 Yrs
—
10 Yrs
—
Benchmark
MSCI All Country World Index
Underlying funds
![]() Active funds focus on outperforming the market compared to a specific benchmark through a portfolio manager’s selections. Passive funds seek to mimic benchmarks by tracking an index
Active funds focus on outperforming the market compared to a specific benchmark through a portfolio manager’s selections. Passive funds seek to mimic benchmarks by tracking an index
active
Goal
Seeks capital appreciation with an emphasis on investing in businesses that deliver positive change by contributing towards a more sustainable and inclusive world.
Commentary
For donors with a long-term granting horizon, Baillie Gifford Global Positive Impact Stock Fund seeks growth companies with the potential to outperform the fund’s benchmark over the long term that the portfolio managers consider to have core ambitions of delivering positive change.
Expense Ratio ![]() Last updated 03/31/2026
Last updated 03/31/2026
0.10%
Risk/granting time horizon
Returns![]() Last updated 03/31/2026
Last updated 03/31/2026
Qtr
0.73%
1 Yr
25.81%
5 Yrs
6.28%
10 Yrs
—
Benchmark
FTSE Global All Cap ex U.S. Choice Index
Underlying funds
![]() Active funds focus on outperforming the market compared to a specific benchmark through a portfolio manager’s selections. Passive funds seek to mimic benchmarks by tracking an index
Active funds focus on outperforming the market compared to a specific benchmark through a portfolio manager’s selections. Passive funds seek to mimic benchmarks by tracking an index
passive
Goal
Seeks to track the performance of a benchmark index that measures the investment return of large-, mid-, and small-capitalization companies located in developed and emerging markets outside of the United States, while adhering to certain environmental, social, and corporate governance criteria.
Commentary
ESG International Stock allows donors to align charitable investments with personal values. Companies are screened for certain ESG criteria, and the fund utilizes three levels of restrictiveness for exclusions, as companies are screened on primary (i.e., producer/manufacturer) and, in most cases, secondary (i.e., retailer/supplier) involvement in the ESG exclusion categories using revenue-based thresholds. Least restrictive categories include adult entertainment, alcohol, and gambling. Moderately restrictive categories include tobacco, cannabis, and conventional (military) weapons. Most restrictive categories include controversial weapons, civilian firearms, nuclear power, and fossil fuels. The index fund also excludes stocks of certain companies that the index provider determines do not meet standards of U.N. global compact principles and companies that do not meet certain diversity criteria.
Compare Investments with a click
What might your charitable investment portfolio look like? Use our side-by-side tool to compare up to four Vanguard Charitable investment options and see how they complement your giving strategy.
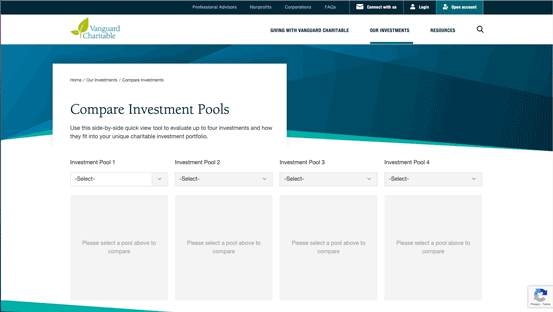
- Expense ratios are assessed by the Vanguard mutual funds/exchange-traded funds (ETFs) and vary based on allocation; Vanguard Charitable does not itself charge investment fees. While they may be invested in mutual funds or ETFs, the investment options are not themselves mutual funds, nor are they publicly traded. They are not available for investment by any individual or organization apart from Vanguard Charitable. As such, prospectuses only exist for the underlying mutual funds, and not for the Vanguard Charitable investment options.
- Account expense ratios utilize the Institutional Plus or Institutional Select share class of the underlying Vanguard mutual funds where applicable.
- Funds underlying Vanguard Charitable investment options may change without notice so long as the new underlying fund has similar characteristics and goals as the previous underlying fund.
- Income benchmark: 80% Spliced Bloomberg Barclays U.S. Aggregate Float Adjusted Index, 14% Spliced Total Stock Market Index, 6% Spliced Total International Stock Market Index. Spliced Bloomberg Barclays U.S. Aggregate Float Adjusted Index: Bloomberg Barclays U.S. Aggregate Bond Index through December 31, 2009; Bloomberg Barclays U.S. Aggregate Float Adjusted Index thereafter. Spliced Total Stock Market Index: Dow Jones Wilshire 5000 Index through April 22, 2005; MSCI US Broad Market Index through June 2, 2013; and CRSP US Total Market Index thereafter. Spliced Total International Stock Market Index: Total International Composite Index through August 31, 2006; MSCI EAFE + Emerging Markets Index through December 15, 2010; MSCI ACWI ex US IMI Index through June 2, 2013; and FTSE Global All Cap ex US Index thereafter.
- Conservative Growth benchmark: 60% Spliced Bloomberg Barclays U.S. Aggregate Float Adjusted Index, 30% Spliced Total Stock Market Index, and 10% Spliced Total International Stock Index. Spliced Bloomberg Barclays U.S. Aggregate Float Adjusted Index: Bloomberg Barclays U.S. Aggregate Bond Index through December 31, 2009; Bloomberg Barclays U.S. Aggregate Float Adjusted Index thereafter. Spliced Total Stock Market Index: Dow Jones Wilshire 5000 Index through April 22, 2005; MSCI US Broad Market Index through June 2, 2013; and CRSP US Total Market Index thereafter. Spliced Total International Stock Market Index:Total International Composite Index through August 31, 2006; MSCI EAFE + Emerging Markets Index through December 15, 2010; MSCI ACWI ex US IMI Index through June 2, 2013; and FTSE Global All Cap ex US Index thereafter.
- Moderate Growth benchmark: 60% Wilshire 5000 Index and 40% Lehman Aggregate Bond Index through December 31, 2009; 45% Balanced Composite Index, 45% Wellington Composite Index, and 10% Spliced Total International Stock Index thereafter. Balanced Composite Index: Made up of two unmanaged benchmarks, weighted 60% Dow Jones Wilshire 5000 Index and 40% Lehman Aggregate Bond Index through May 31, 2005; 60% MSCI US Broad Market Index and 40% Bloomberg Barclays Capital Aggregate Bond Index through January 14, 2013; and 60% CRSP US Total Market Index and 40% Bloomberg Barclays U.S. Aggregate Float Adjusted Index thereafter. Wellington Composite Index: 65% S&P 500 Index and 35% Lehman Long Credit AA or Better Index through February 29, 2000; 65% S&P 500 Index and 35% Bloomberg Barclays Capital Credit A or Better Index thereafter. Spliced Total International Stock Market Index: Total International Composite Index through August 31, 2006; MSCI EAFE + Emerging Markets Index through December 15, 2010; MSCI ACWI ex US IMI Index through June 2, 2013; and FTSE Global All Cap ex US Index thereafter. *On Thursday, April 13, 2023, the underlying funds of the Moderate Growth investment changed to 42% Vanguard Total Stock Market Index Fund (VSMPX), 40% Vanguard Total Bond Market Index Fund (VBMPX), and 18% Vanguard Total International Stock Index Fund (VTPSX). Previously, the composition had been 45% Vanguard Balanced Index Fund (VBAIX), 45% Vanguard WellingtonTM Fund (VWENX), and 10% Vanguard Total International Stock Index Fund (VTPSX). The investment performance report for the first quarter of 2023 reports the underlying funds as of 03/31/2023. The web page lists the current underlying funds as of 04/13/2023.*
- Growth benchmark: 80% Wilshire 5000 Index and 20% Lehman Aggregate Bond Index through December 31, 2009; 55% Spliced Total Stock Market Index, 20% Spliced Bloomberg Barclays U.S. Aggregate Float Adjusted Index, and 25% Spliced Total International Stock Market Index thereafter. Spliced Bloomberg Barclays U.S. Aggregate Float Adjusted Index: Bloomberg Barclays U.S. Aggregate Bond Index through December 31, 2009; Bloomberg Barclays U.S. Aggregate Float Adjusted Index thereafter. Spliced Total Stock Market Index: Dow Jones Wilshire 5000 Index through April 22, 2005; MSCI US Broad Market Index through June 2, 2013; and CRSP US Total Market Index thereafter. Spliced Total International Stock Market Index: Total International Composite Index through August 31, 2006; MSCI EAFE + Emerging Markets Index through December 15, 2010; MSCI ACWI ex US IMI Index through June 2, 2013; and FTSE Global All Cap ex US Index thereafter.
- The underlying fund for the Money Market investment pool has been updated to Vanguard’s Cash Reserves Federal Money Market Fund, reducing the expense ratio to 0.10% as of October 27, 2022. To learn more, read our investment lineup update.
- Short-Term Treasury Inflation-Protected Securities (Short-Term TIPS) benchmark: Bloomberg U.S. 0-5 YearTreasury Inflation Protected Securities Index.
- Total Bond benchmark: Spliced Bloomberg Barclays U.S. Aggregate Float Adjusted Index reflects the performance of the Bloomberg Barclays U.S. Aggregate Bond Index through December 31, 2009; Bloomberg Barclays U.S. Aggregate Float Adjusted Index thereafter.
- Total International Bond benchmark: Bloomberg Barclays Global Aggregate ex-USD Float Adjusted RIC Capped Index Hedged: Includes government, government agency, corporate, and securitized non-U.S. investment grade fixed-income investments, all issued in currencies other than the U.S. dollar and with maturities of more than one year.
- Total Equity benchmark: 55% S&P 500 Index, 15% S&P Completion Index, and 30% Spliced Total International Stock Market Index. Spliced Total International Stock Market Index: Total International Composite Index through August 31, 2006; MSCI EAFE + Emerging Markets Index through December 15, 2010; MSCI ACWI ex US IMI Index through June 2, 2013; and FTSE Global All Cap ex US Index thereafter.
- Total U.S. Stock benchmark: Total U.S. Stock benchmark: Spliced Total Stock Market Index reflects the performance of the Dow Jones Wilshire 5000 Index through April 22, 2005; MSCI US Broad Market Index through June 2, 2013; and CRSP US Total Market Index thereafter.
- S&P 500 benchmark: Standard & Poor’s 500 Index.
- Large-Cap Value benchmark: CRSP US Large Cap Value Index.
- Large-Cap Growth benchmark: CRSP US Large Cap Growth Index.
- Total International Stock benchmark: Spliced Total International Stock Market Index reflects the performance of the Total International Composite Index through August 31, 2006; MSCI EAFE + Emerging Markets Index through December 15, 2010; MSCI ACWI ex US IMI Index through June 2, 2013; and FTSE Global All Cap ex US Index thereafter.
- Extended Market benchmark: S&P Completion Index.
- Real Estate benchmark: MSCI U.S. Investable Market Real Estate 25/50 Index.
- Ultra-Short-Term Bond benchmark: Bloomberg U.S. Treasury Bellwethers: 1 Year Index.
- Core Bond benchmark: Bloomberg U.S. Aggregate Float Adjusted Index.
- Windsor II benchmark: Russell 1000 Value Index.
- U.S. Growth benchmark: Russell 1000 Growth Index.
- International Core Stock benchmark: MSCI All Country World Index ex USA Net.
- High-Yield Corporate benchmark: High-Yield Corporate Composite Index.
- Dividend Growth benchmark: S&P U.S. Dividend Growers Index Total Return.
- Explorer benchmark: Russell 2500 Growth Index.
- Commodity Strategy benchmark: Bloomberg Commodity Index Total Return.
- Balanced Index benchmark: Balanced Composite Index: Weighted 60% Dow Jones U.S. Total Stock Market Index (formerly known as the Dow Jones Wilshire 5000 Index) and 40% Lehman Brothers U.S. Aggregate Bond Index through May 31, 2005; 60% MSCI US Broad Market Index and 40% Bloomberg Barclays U.S. Aggregate Bond Index through December 31, 2009; 60% MSCI US Broad Market Index and 40% Bloomberg Barclays U.S. Aggregate Float Adjusted Index through January 14, 2013; and 60% CRSP US Total Market Index and 40% Bloomberg Barclays U.S. Aggregate Float Adjusted Index thereafter.
- Wellington benchmark: Wellington Composite Index: 65% S&P 500 Index and 35% Lehman U.S. Long Credit AA or Better Bond Index through February 29, 2000; 65% S&P 500 Index and 35% Bloomberg Barclays U.S. Credit A or Better Bond Index thereafter.
- European Stock benchmark: Spliced European Stock Index reflects performance of the MSCI Europe Index through March 26, 2013; FTSE Developed Europe Index through September 30, 2015; and FTSE Developed Europe All Cap Index thereafter.
- Pacific Stock benchmark: Spliced Pacific Stock Index reflects performance of the MSCI Pacific Index through March 26, 2013; FTSE Developed Asia Pacific Index through September 30, 2015; and FTSE Developed Asia Pacific All Cap Index thereafter.
- Emerging Markets benchmark: Spliced Emerging Markets Index reflects performance of the Select Emerging Markets Index through August 23, 2006; the MSCI Emerging Markets Index through January 9, 2013; the FTSE Emerging Transition Index through June 27, 2013; the FTSE Emerging Index through November 1, 2015; the FTSE Emerging Markets All Cap China A Transition Index through September 18, 2016; and the FTSE Emerging Markets All Cap China A Inclusion Index thereafter.
- Vanguard Charitable has entered into an arrangement with Hamilton Lane whereby Hamilton Lane will provide an ongoing revenue share to Vanguard Charitable in connection with shares of the Hamilton Lane Private Assets Fund (“Fund”) held by Vanguard Charitable. The revenue sharing arrangement provides that Vanguard Charitable will receive a percentage (25 basis points) of revenue based on the amount of Fund shares held by Vanguard Charitable. The revenue is used by Vanguard Charitable to partially offset costs associated with making the investment available for recommendation. The receipt of revenue may create an incentive for Vanguard Charitable to promote the Hamilton Lane Fund over investments for which Vanguard Charitable does not share in revenue.
- Underlying funds for the Values-Driven Investment options are Vanguard exchange-traded funds. However, all Vanguard Charitable investment options are traded once daily and pricing is based on the NAV.
- ESG U.S. Stock benchmark: FTSE U.S. All Cap Choice Index
- ESG International Stock benchmark: FTSE Global All Cap ex U.S. Choice Index
- ESG Global Stock Pool Benchmark: Weighted 70% FTSE U.S. All Cap Choice Index and 30% FTSE Global All Cap ex U.S. Choice Index.
- Baillie Gifford Global Positive Impact Stock Fund benchmark: MSCI All Country World Index Net.
- The potential for risk in Vanguard funds can be categorized in levels from 1 to 5. Learn more in our FAQs.
- Any Portfolio Solutions option can be combined with other Solutions, Portfolio Builders, and Values-Driven Investment options.